How to Read 5,000 Pages of a Government Package
October 30 in Russia celebrated the Day of the founding of the fleet
I think it's exemplary. The representative body agreed on the task of the head of state - to create a fleet - and the source of financing: the collection from the owners of peasants is proportional to the number of households. How many ships to build and how many to assemble had to be determined by the executive branch. But information about the yards should be presented, “without silence”, and the duty should be distributed, “how much is decent”, that is, to ensure full accounting and proportionality of the load.
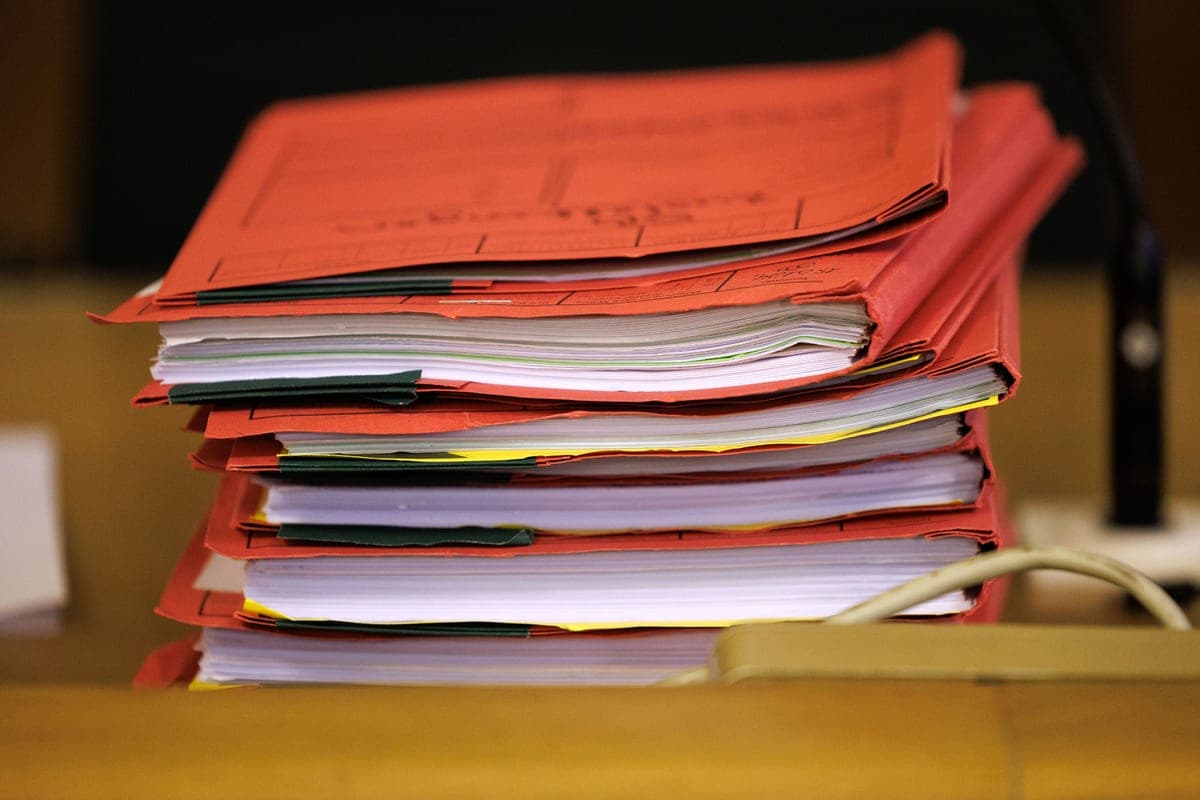
I remembered this, looking at the draft federal budget for 2027 and the next two years, adopted by the State Duma in the first reading. It is by looking rather than reading: reading the 4,727 pages of the government budget package, which includes draft budgets of the Social Fund and the MHI Fund and tax laws, will not in itself help to decide whether the project is good or could be better. Even if you have to vote for him, I judge from my parliamentary experience of fourteen years of participation in such voting.
The Ministry of Finance also publishes “Budget for Citizens” – a squeeze from the budget package: fourteen pages, several thousand words and about a thousand numbers. But without understanding what to look for, it will remain a body of knowledge for an incomprehensible purpose.
Budgets, meanwhile, are the ones that most accurately reflect a state’s policies: its real priorities, which may differ from individual politicians’ statements and campaign promises. From the budgets you can really learn what the authorities expect from the economy and how they intend to influence it. So the ability to read budgets helps to make decisions in both elections and markets.
In the first reading, deputies approve the main characteristics of the budget. How do you rate them? Is there enough money to solve the country’s problems? Do they not have the wealth to pay for them? Is it better to increase the deficit and public debt, cut spending, or raise taxes? And with a surplus – to increase reserves, reduce taxes or increase spending?
The answer requires an assessment of the state of the economy, its trends and development priorities. To evaluate is to compare with something comparable: other countries, sectors of the economy, previous years. Billions alone explain little. More important is the proportion, rate of change and ratio. I suggest that we look first at four groups of indicators.
The first is gross domestic product at purchasing power parity, GDP at PPP. It allows you to compare the size of economies taking into account differences in prices. Dividing it by the number of inhabitants, we get an indicator of per capita production. It allows us to judge the average level of wealth in a country, but does not take into account how income is distributed among its citizens.
The second is the distribution of GDP between the final consumption of the state and the population, investment and net exports - the difference between exports and imports. The final consumption of the state includes its current expenses for the fulfillment of its obligations in the social and other spheres (except for pensions and benefits) and for the development of the country (except for investments). The debate over how much of the social product should be redistributed to the state is one of the main political issues. Some place emphasis on justice and solidarity, others on the effectiveness of private initiative and the risk of weakening it by excessive diversion of income. The first is considered to be left, the second is right.
The proportion of a population's consumption indicates the social value of its current needs. The share of investments is about the value of savings as a basis for development. Net exports characterize the foreign trade balance, the sign and magnitude of the components of which depend, as we have seen in recent years, on the position of the country not only in the world economy, but also in world politics.
The third group is the distribution of public spending among social obligations, the rule of law, defense, governance, economic development and debt servicing. For international comparisons, it is important to consider the costs of all levels of government and public social funds, since the same tasks in different countries can be financed from different budgets.
Anyone can compare these distributions, directions, and rates of change to statements of authority. If the declared priority loses its share of expenses year after year, even if their volume grows, it is worthwhile to demand an explanation and take a closer look at the results.
The fourth group is deviations of actual income and expenses from approved ones. They are unavoidable — it is impossible to foresee everything — but they can also be the result of mistakes or low discipline of departments. As the budgets are implemented, changes are made, especially noticeable at the end of the year, when it is too late to discuss anything. As a result, the budget law is considered to be implemented, and only its developers learn lessons, but we cannot verify this either.
What can we do to compare the totals? In terms of GDP by PPP, Russia is among the largest economies in the world, second only to China, the United States and India and ahead of Japan and Germany. In the first quarter of a century, this figure doubled in our country, while in the United States, Germany and Japan it grew less significantly, but in China and India it increased five and three times, respectively. According to the per capita indicator, the picture is different: Russia is noticeably ahead of China and especially India, but inferior to the United States, Germany and Japan. The size of the economy does not always determine the capabilities of the average person.
The distribution of GDP is also significant. In 2000, Russia sharply stood out among these countries share of net exports - about 20%. By 2025, it had fallen to about 3%. At the same time, the share of investment increased from 19 to 26%, population consumption from 46 to 51%, state final consumption from about 15 to 19%.
In China, the share of investment also rose by about seven percentage points, reaching almost 40% of GDP. The share of population consumption has dropped to about the same level. In India, investment also accounts for a significantly larger share of GDP than in Russia. In the U.S. and Japan, the share of household consumption increased, while investment declined slightly. Countries allocate resources differently between current consumption and accumulation.
A separate question is what the state spends the collected funds. I compared the structure of total government spending in Russia, the United States, China, Japan, and Germany in 2010 and 2020. In several major areas, Russia was the closest to the United States.
In 2020, social welfare, healthcare, education, culture and sports accounted for about 60 percent of Russian government spending and 61 percent of the United States. Both countries spent about 7.5% on defense, about 6% and 7% on national functions without debt service, respectively. Over the past decade, social share has increased in both countries. At the same time, the share of military spending in the United States decreased significantly, while in Russia it remained almost unchanged.
In China, the social sphere accounted for about 46% of spending, defense – less than 4%. In Japan and Germany, the social share was higher than in Russia, at about 65 and 71 percent. The proximity of Russia and the United States in these shares does not mean the same quality of services. The cost structure shows priorities and other indicators are needed to measure results.
I would like to continue the comparison until 2025. But the openness of Russia’s budget statements after 2022 has declined, and the previous level of detail cannot be replicated. This limits a society’s ability to evaluate public policy, because when you compare the plan of one year with the fact of another, it is easy to mistake a change in expectations for a change in policy.
In the 1980s, a popular newspaper featured the headline “If I were the director”: readers suggested how to do something better in the country. If I were a director, I would change the way the parliament approves the budget. Instead of thousands of pages, I would reduce the approved part to several dozen indicators with clear economic and political meaning, understandable to deputies and interested citizens.
From these indicators, the tasks and limitations of the state, the sources of financing its expenses, the limits of the tax burden and debt, the main proportions of expenses should be visible. And each indicator of the project should be compared with the base plan of the current year, its expected execution and the average annual execution over the previous five or ten years. The departmental details necessary for the execution of the budget should be determined within the framework established by the State Duma by the government, which will have to report to it only for compliance with these frameworks.
Then MPs would not have to take responsibility for thousands of decisions that can only be taken on faith. And it would be easier for citizens to see what values and interests the government prioritizes and decide how close they are to their own.